SRS Risk Framework Report
Explore the SRS Risk Framework Report in Shrimpl for a clear understanding of your farm’s risk profile. This guide walks you through accessing and interpreting the report, step by step, just as shown in the original walkthrough video.
Introduction
The SRS Risk Framework Report in Shrimpl helps you assess your farm’s performance across critical risk categories. Reviewing this report reveals not just the current risk level but also highlights problem areas needing attention.
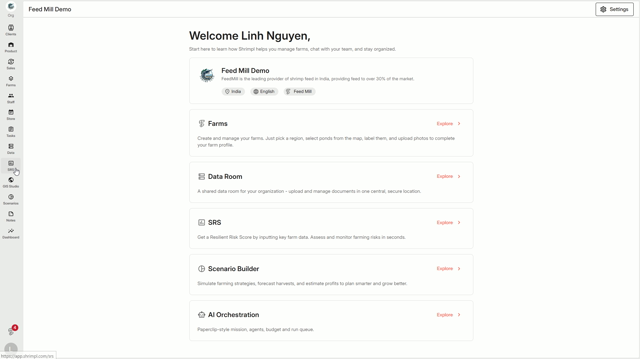
Step 1: Click SRS from the left navigation menu.
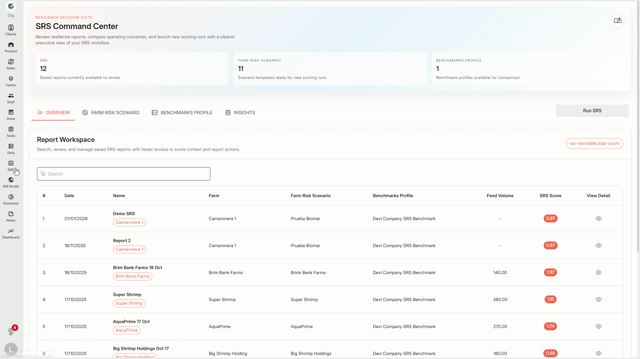
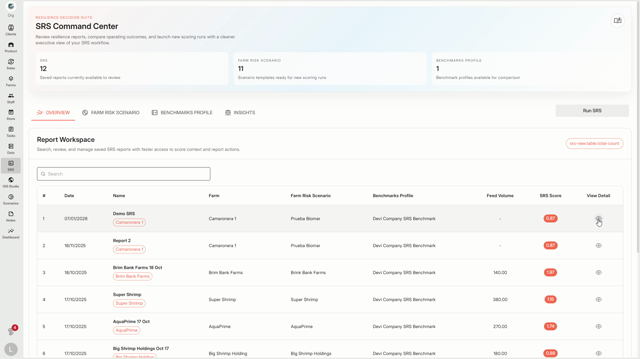
Step 2: Select Reports and choose a specific report to open.
Step 3: View the overall SRS Score displayed at the top. This score combines every risk category into a single rating for your farm.
The report’s score

indicates the current risk state—like a 0.87 means the farm’s risk is critical.
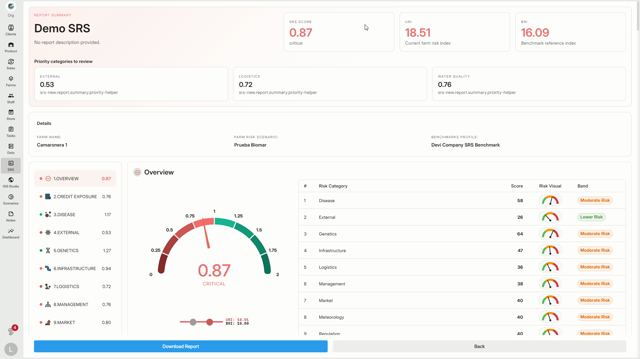
Step 4: Check the values beside the score: URI and BRI. URI shows your farm’s current risk, while BRI shows the benchmark or what’s expected.


When URI is higher than BRI, that category is considered more critical.

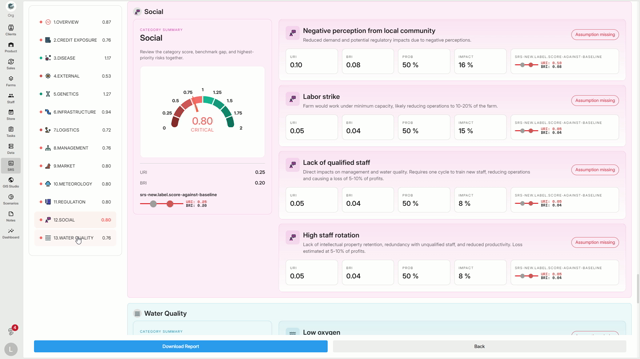
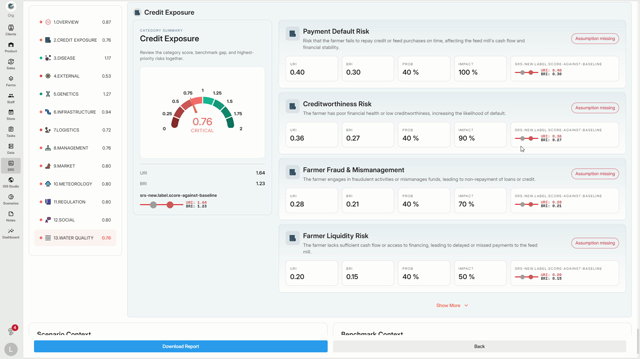
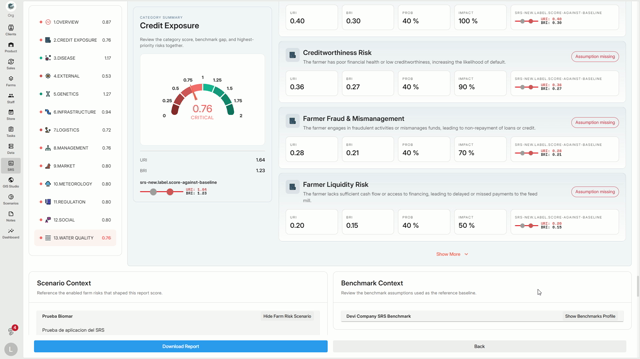
Step 5: On the left panel, find all risk categories listed, such as Disease, External, Genetics, Infrastructure, Logistics, Management, Market, Meteorology, Regulation, Social, Water Quality, and Credit Exposure.

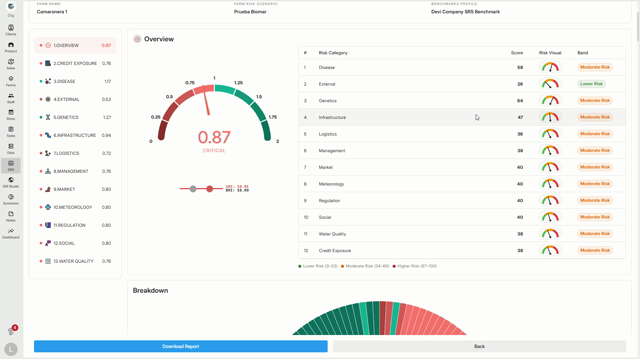
Each category gets its own score—the lower the score, the higher the risk. The Overview section explains how these are organized.
The center gauge shows the overall score for each category, and the table at the right ranks categories by risk band (lower, moderate, higher). The Breakdown chart below visualizes each category’s contribution to your final SRS Score—bigger slices signal more impact.
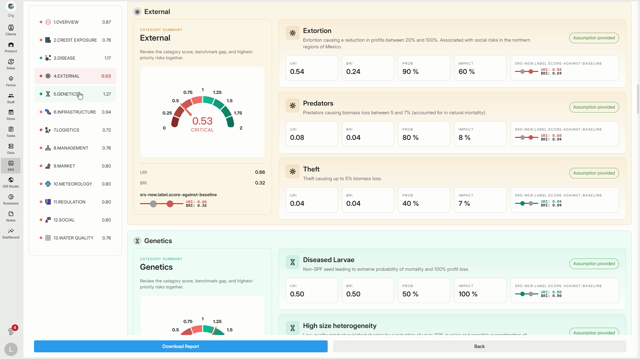
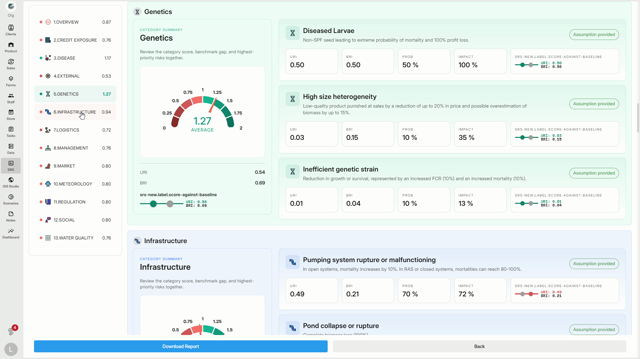
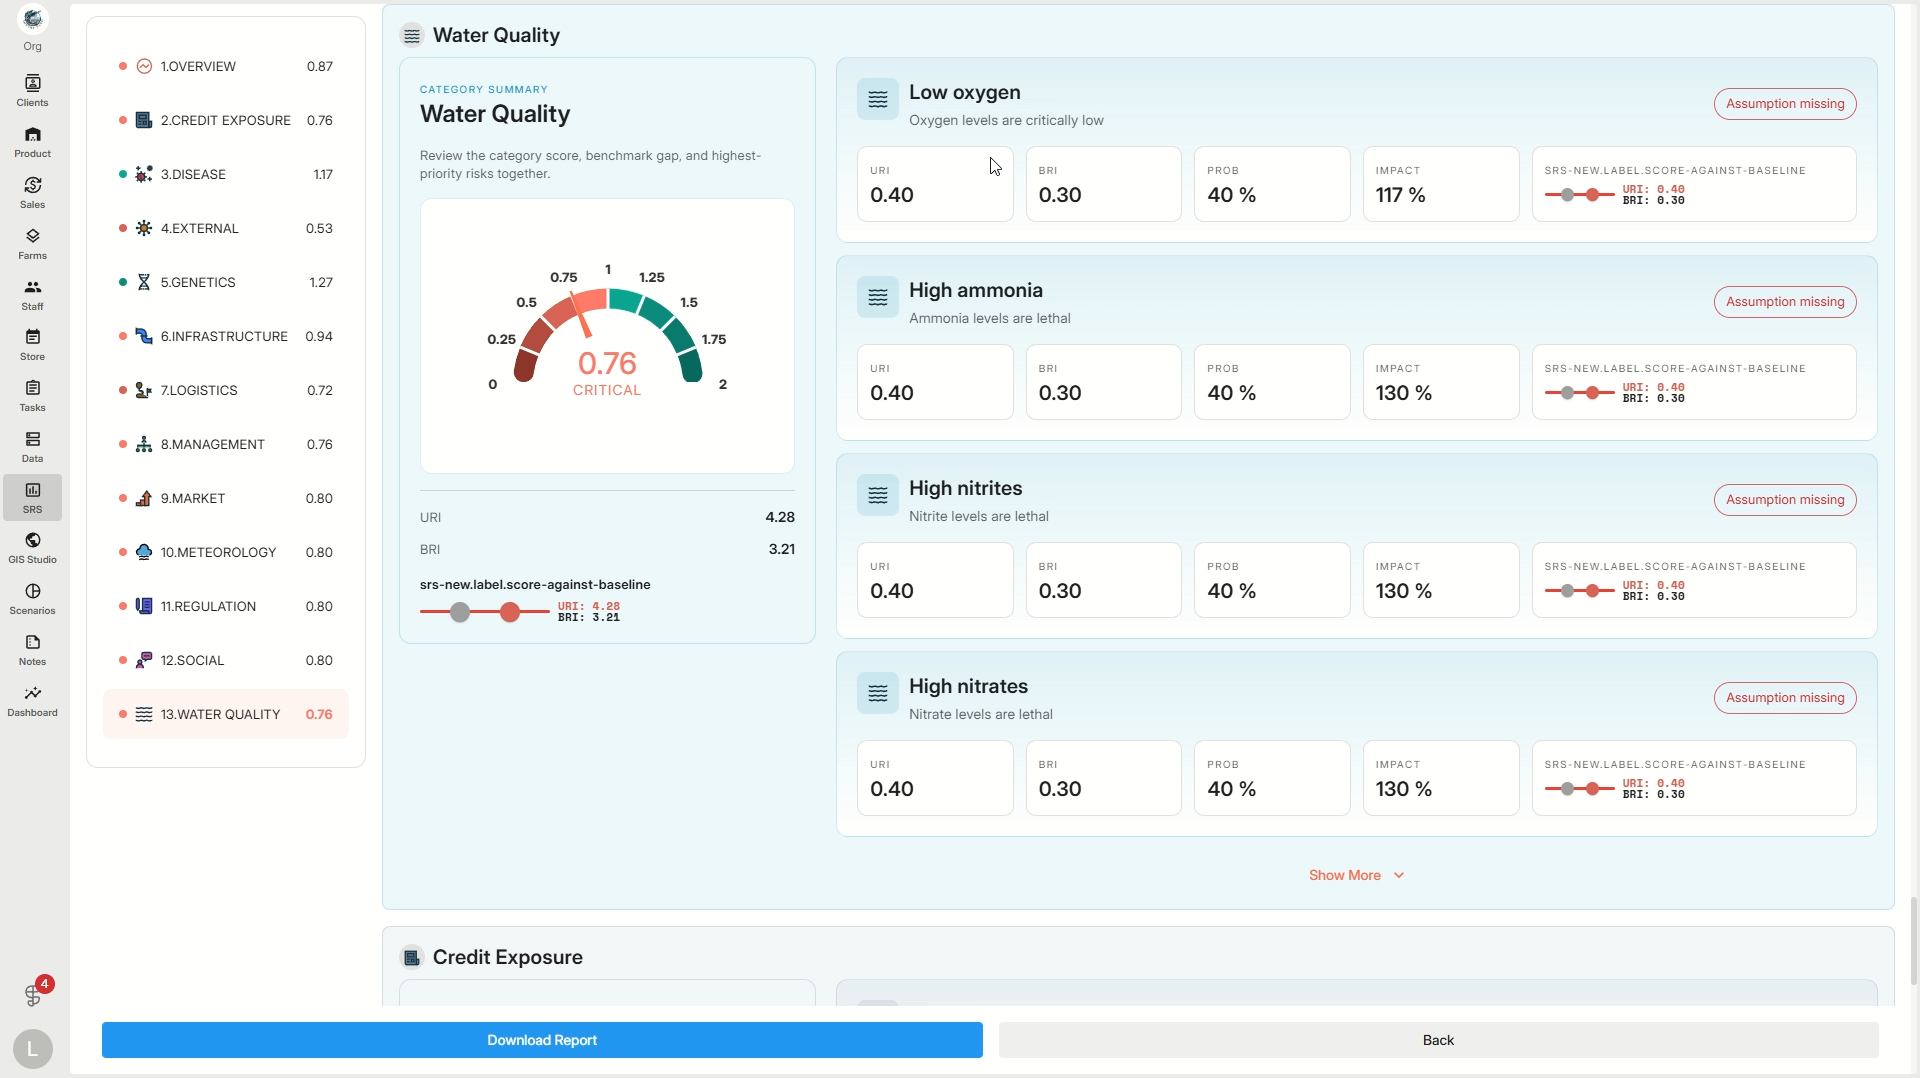
Step 1: Scroll down for detailed breakdowns for each category.
For example, under Genetics, you see specific risks such as Diseased Larvae, High Size Heterogeneity, and Inefficient Genetic Strain.
In Infrastructure, the report highlights issues like Pump Failure and Pond Collapse.
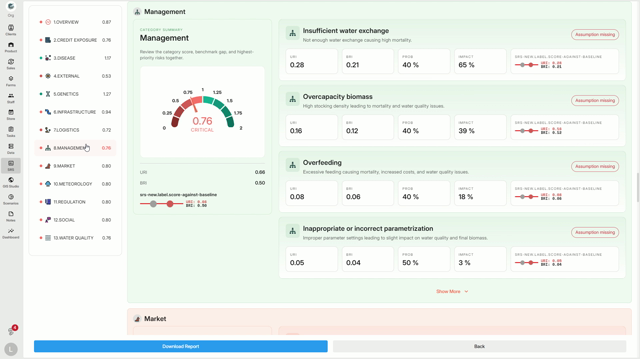
Management details risks such as Insufficient Water Exchange and Overfeeding.
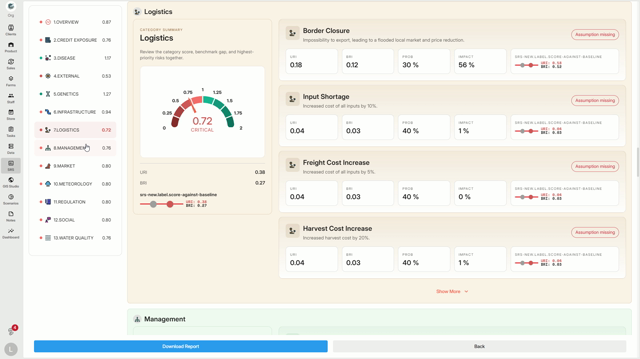
Each risk displays four values:
-
URI: Current risk contribution
-
BRI: Benchmark contribution
-
Probability: Likelihood of occurrence
-
Impact: Severity if it happens
For instance, in Water Quality, the risk of Low Oxygen shows a URI of 0.40 and a BRI of 0.30—telling you your current risk is above the benchmark, so this category becomes more critical.
Step 2: At the report’s end, find Scenario Context—risks currently assumed for your farm.
The Benchmark Context shows reference values used to gauge your risk.
Comparing these contexts

gives a clear picture: if your scenario expects a risk (like disease) more often than the benchmark, that risk increases your category’s score.
Conclusion
The SRS Risk Framework Report points out which categories are driving your farm’s risk, why it’s happening, and where intervention matters most. Use this insight to direct attention where it’s needed—and strengthen your farm’s resilience.