Shrimpl Help Shrimpl Help

  • Home
  • Shrimpl App
Home / 🛡️Shrimpl Resiliency Score (SRS) / Understanding the SRS Insights Console

Understanding the SRS Insights Console

Less than a minute 0

Understanding the SRS Insights Console

Get an overview of your team’s workspace activity, dive into advanced data visualizations, and explore key metrics across SRS platforms. Here’s how to navigate these features for more insightful analysis.


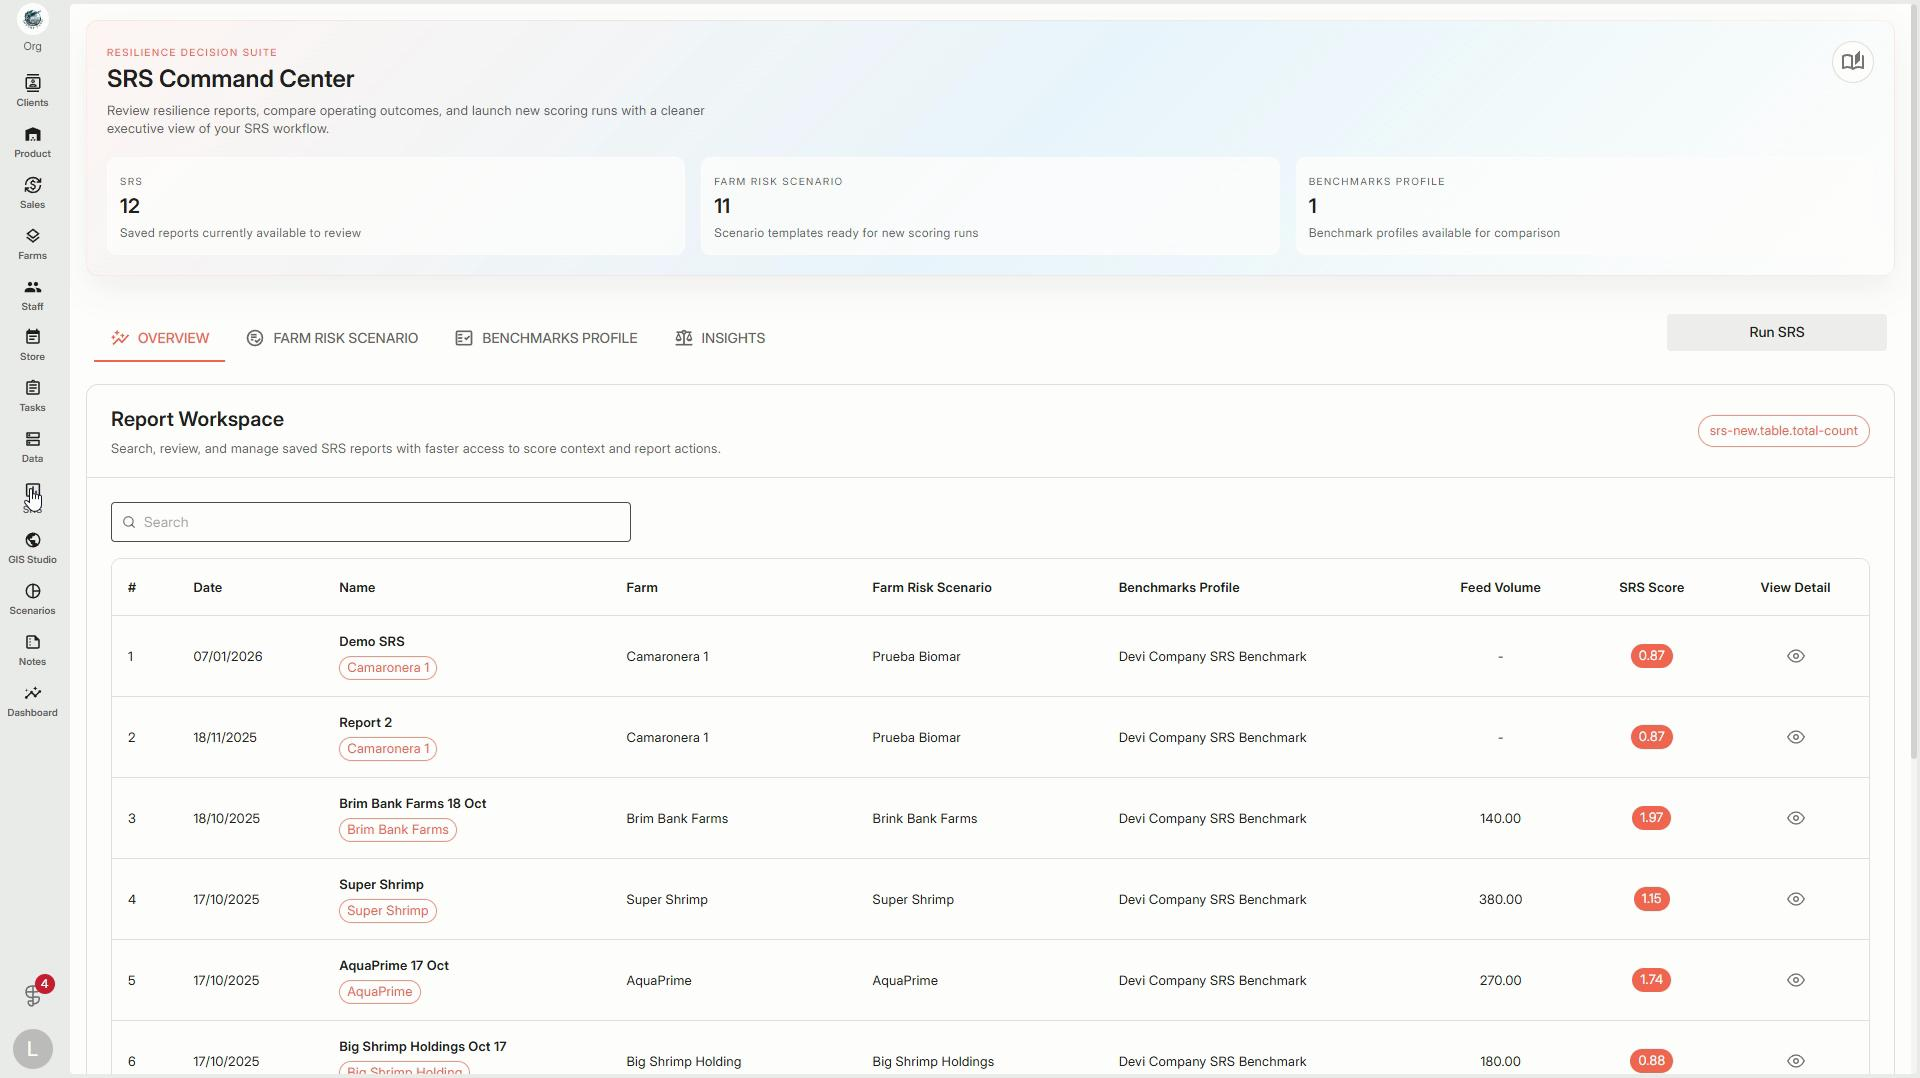
Step 1: Start in the SRS Command Center. Check the Recent Workspaces table to review workspace activity, costs, and quick actions.


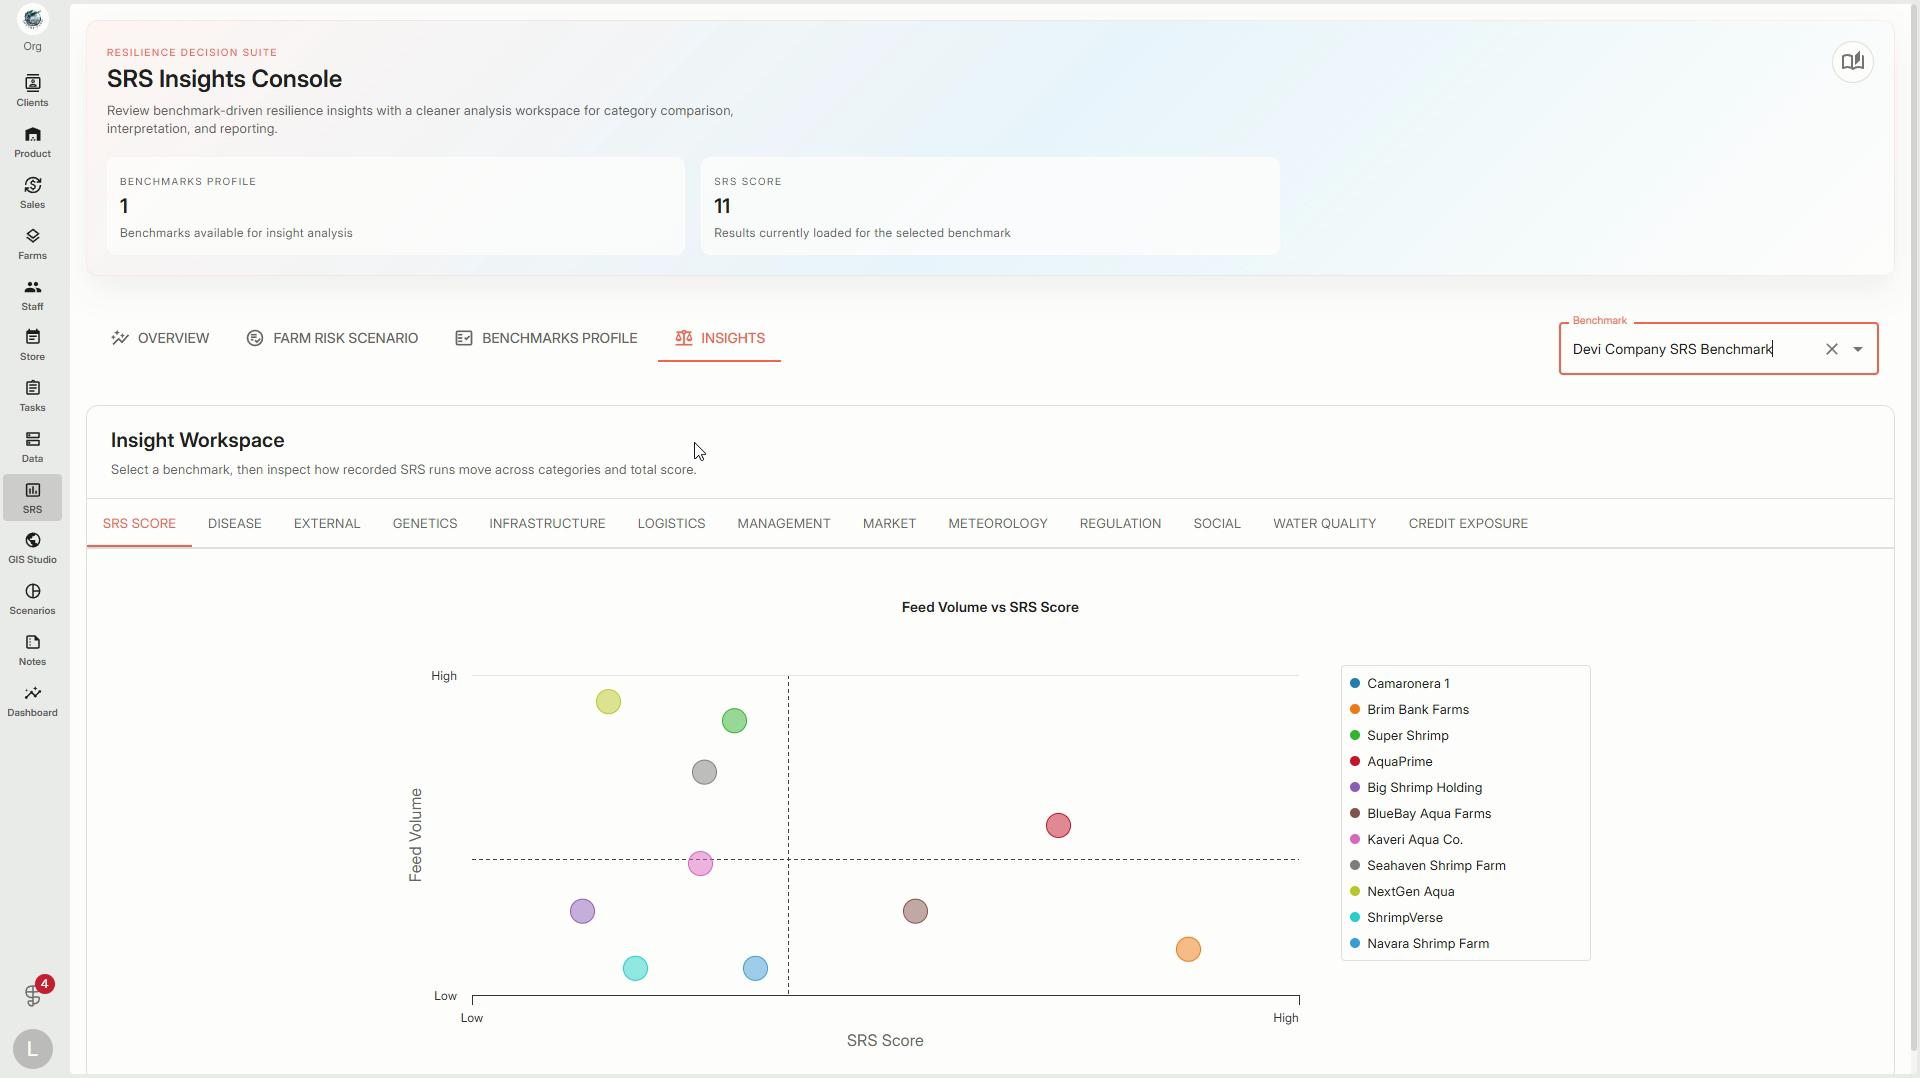
Step 2: Move to the SRS Insights Console. Here, you’ll see the Insight Workspaces scatter plot — a dynamic visualization of multiple categories. Use color-coding and filters to focus on the data that matters most.


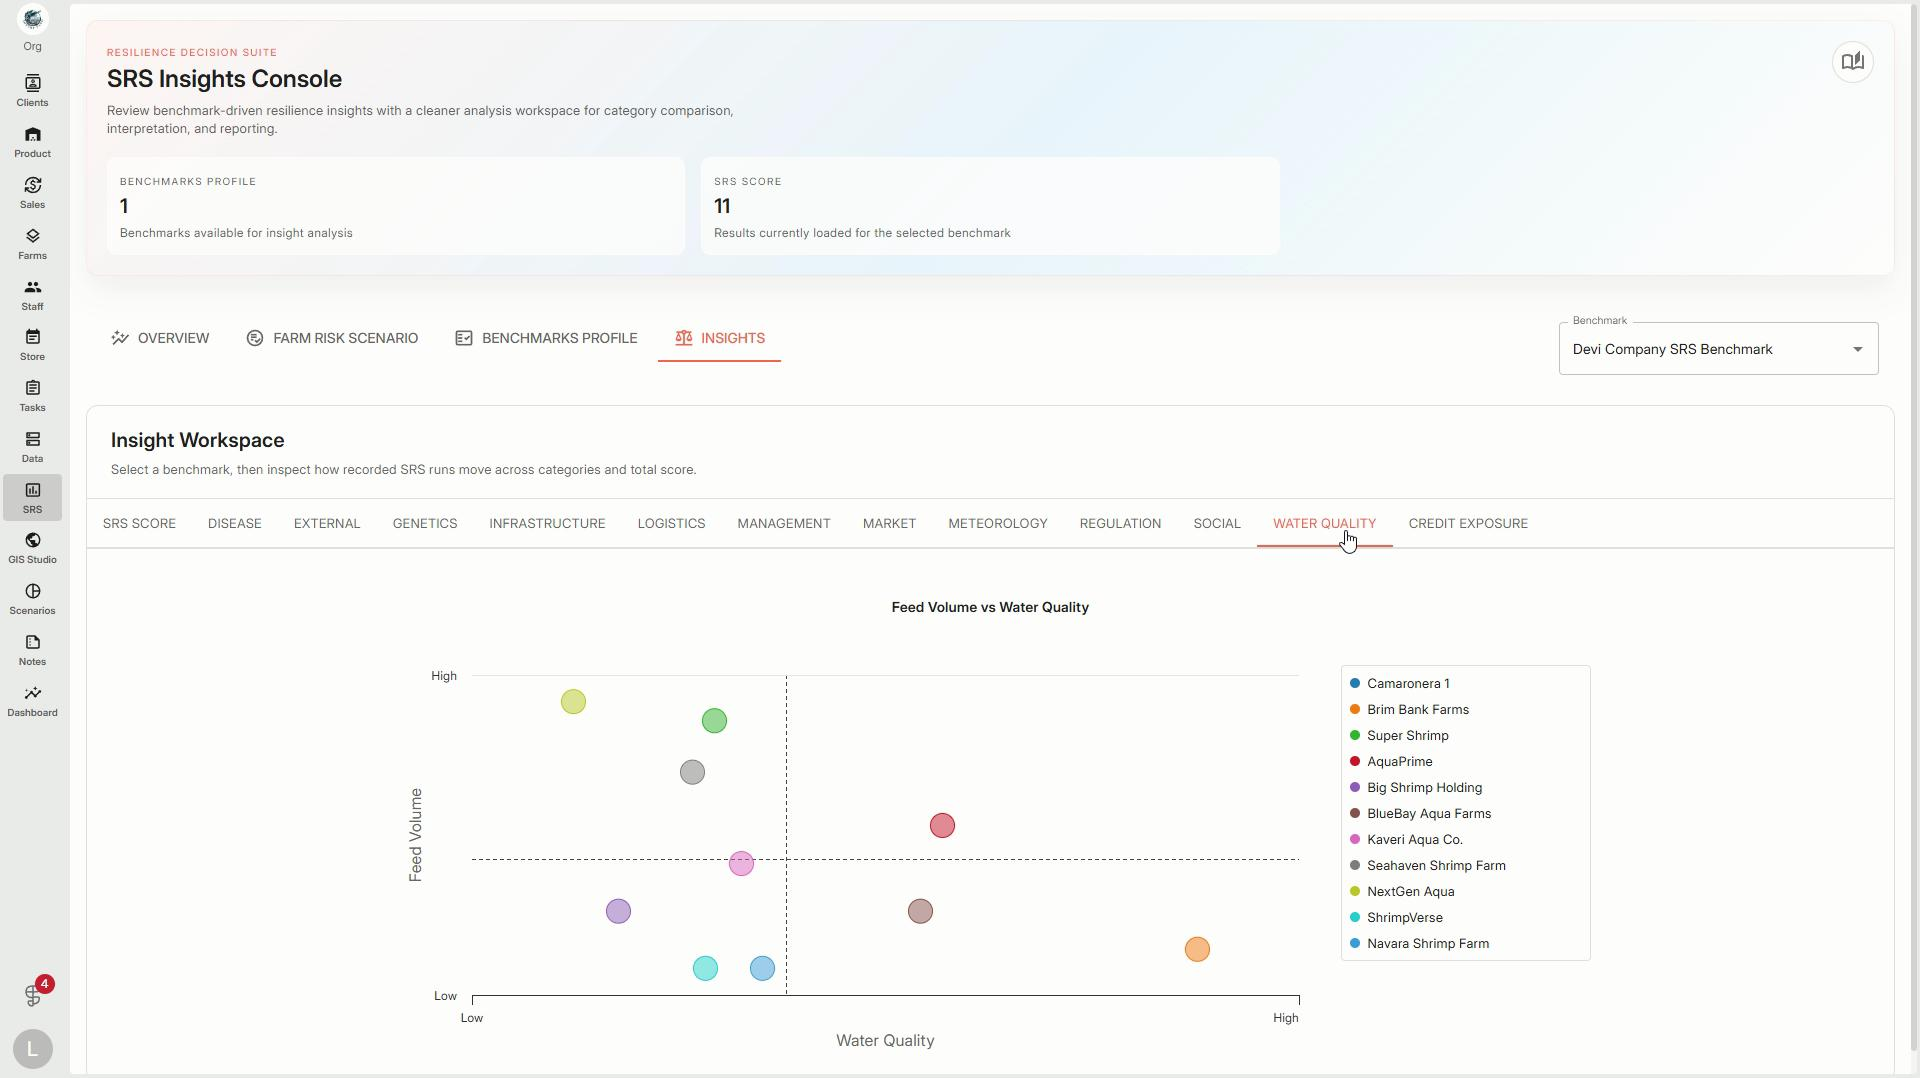
Step 3: Switch to the SRS Insights Console. Explore a similar scatter plot and watch for interactive reference lines as you hover over or select points. These guides make it easier to interpret your key SRS metrics.


With these tools, stay informed on workspace trends and dig deeper into your most important metrics. Use visualizations and filters to guide smarter decisions and share insights with your team.

🛡️Shrimpl Resiliency Score (SRS)

Related Articles

  • Understanding the SRS Risk Framework Report

Categories

  • 11✍️ Account Settings
  • 1✨ Getting Started
  • 2💼 Client Management
  • 2📁 Farm Data
  • 2📝 Task Management
  • 2🛡️Shrimpl Resiliency Score (SRS)
  • 6🦐 Farm Management

Most Viewed

  • Use this website 110
  • How to Sign up with Phone number 37
  • How to Log in with Email account 37
  • What should I do when I forgot my password? 28
  • How do I change my password? 28

Most Liked

  • Use this website 3
  • How to Log in with Phone Number 1
  • How to Discover & Join an Organization 1

Social

Article Categories

✍️ Account Settings ✨ Getting Started 💼 Client Management 📁 Farm Data 📝 Task Management 🛡️Shrimpl Resiliency Score (SRS) 🦐 Farm Management
Shrimpl Pte Ltd, All rights reserved